Showing all posts tagged #surveys:


US Univ. of Michigan Sentiment: Lowest expected long term inflation rate since this question was first asked in 1979!

Posted on February 12th, 2016

Main takeaways:
  • Lowest expected long term inflation rate since this question was first asked in 1979!
  • Declining equity prices, weak global economy, ..., have become old news -- mentioned by 1-in-5 among rich households (down from 1-in-3 in Jan and last Sept).
  • Current level of Sentiment is associated with real consumption growing at 3.1%.
  • Historical episodes show that real consumption grows in the 2.2%-4.0% range while Sentiment is near current levels, with no episode of real growth below 2%.


Additional highlights in the report:
  • "February decline was due to a less favorable outlook for the economy during the year ahead"
  • "consumers viewed their personal financial situations somewhat more favorably"
  • "consumers anticipated the lowest long term inflation rate since this question was first asked in the late 1970".
  • "The proporstion of households that reported an improved financial situation rebounded to 45% in early February, the highest level in six months"
  • "when asked about their financial prospects over the next five years, 54% anticiated improved finances, while just 10% expected worsening finances over the longer term, the best reading since 1984 "
  • "Although declining equity prices, weak global economy, and sagging exports have continued, they have become old news -- mentioned by one-in-five among households with income in the top third in February, down from one-in-three last month (and in Aug/15)"
  • "fewest consumers in two years to report recent improvement in the economy"
  • "fewest consumers since Aug 2014 to anticipate good times in the economy during the year ahead"
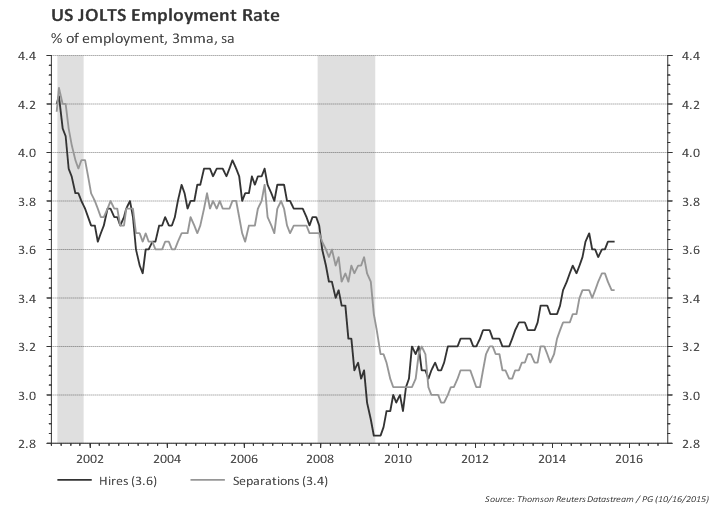
  • "consumers thought that unemployment would inch upward by the end of 2016"
  • "Buying plans remained favorable due to discounted prices and low interest rates"

Preliminary Michigan Sentiment in February at 90.7, down 1.3 points from the January estimate.


Looking closer at the relationship between Michigan Sentiment and household consumption:
The chart below plots the 3mma of Michigan Sentiment in the x-axis and real consumption (3mma, YoY) in the y-axis. The vertical black line shows the most recent monthly print. The expected growth rate of consumption based on the latest Sentiment reading would be close to 3.1%.

Perhaps even more important, the current level of Sentiment is compatible with consumption growth in the 2.2%-4.0% range, with a few outliers above this range and no episode of real consumption growth below 2% in the vicinity of the current level for Michigan Sentiment.


Lowest expected long term inflation rate since this question was first asked in 1979!


US Univ. of Michigan Sentiment: Consumers Unabated

Posted on January 15th, 2016

Main takeaways:
  • Preliminary Michigan Sentiment in January at 93.3, up 0.7 points from December.
  • Sentiment rebounded sharply from Sep/15 low.
  • The recovery in Oct/Dec was led by poor households ("felling better about current situation"), contrasting with concerns among rich households ("worried about the future").
  • January was the first month in which the increase in Sentiment was led by the rich ("all the gain was recorded among households with income above $75k")...
  • ...despite they being aware of the stock price declines and weak global economy.
  • Current level of Sentiment is associated with real consumption growing at 3.4%.
  • Historical episodes show that real consumption grows in the 2.5%-4.5% range while Sentiment is near current levels.
  • 5-year inflation expectation ticked up to 2.7%.


Additional highlights in the report:
  • "Consumer confidence inched upward for the fourth consecutive month due to more positive expectations for future economic growth"
  • "All of the early January gain was recorded among households with incomes above $75k"
  • "Stock price declines and a weakened global economy were spontaneously mentioned by nearly one-third of all households with incomes in the top third, identical to the levels following the August plunge in stock prices"
  • "Nonetheless, households held more favorable prospects for the national economy than in the closing months of 2015"
  • "Buying conditions for household durables were rated favorably by 81% of all consumers for the past two months, the highest level since January 2006"

Preliminary Michigan Sentiment in December at 93.3, up 0.7 points from the December estimate.


Looking closer at the relationship between Michigan Sentiment and household consumption:
The chart below plots the 3mma of Michigan Sentiment in the x-axis and real consumption (3mma, YoY) in the y-axis. The vertical black line shows the most recent monthly print. The expected growth rate of consumption based on the latest Sentiment reading would be close to 3.4%.

Perhaps even more important, the current level of Sentiment is compatible with consumption growth in the 2.5%-4.5% range, with a few outliers above this range and no episode of real consumption growth below 2% in the vicinity of the current level for Michigan Sentiment.


Inflation expectations ticked up to 2.7%.


Philadelphia Fed Business Outlook: weak + interesting special question

Posted on December 17th, 2015

Weak headline Philly Fed, below expectations of a roughly flat 1.0 reading.
The "modified" Philly Fed (using weights / components similar to ISM) shows a small up-tick, but it also depicts a very weak manufacturing.

Philly Fed Diffusion Index
Philly Fed Modified (according to ISM weights)

The special question focused on business costs. As expected, input costs other than labor costs are not a reason for concern. However, a significant share of business expect wage and health costs to increase. This is negative for profits.


US Univ. of Michigan Sentiment: rich vs poor

Posted on December 11th, 2015

Main takeaways:
  • Preliminary Michigan Sentiment in December at 91.8, up 0.5 points from November.
  • Poor consumers are felling better about current situation.
  • Rich consumers are worried about the future.
  • All think unemployment rate has reached a bottom.
  • The overall tone of the report was very positive (see quotes below). Current level of Sentiment is associated with real consumption growing at 3.25%.
  • Historical episodes show that real consumption grows in the 2.25%-4.5% range while Sentiment is near current levels.
  • 5-10y inflation expectation at the 2.6% level.


Additional highlights in the report:
  • "December gain was recorded among households with incomes in the bottom two-thirds (+2.7pp)"
  • "Sentiment Index among consumers with incomes in the top third declined (-4.4pp)"
  • "Largest loss was in how consumers judged prospects for the national economy the year ahead"
  • "Consumers anticipated somewhat lower wage gains and were less optimistic about continued declines in the unemployment rate"
  • "Two-thirds of all consumers expect interest rates to increase in the year ahead, a reading only comparable to the levels last recorded from 2004 to 2006"
  • "During the past three months, the average expected long term inflation rate (2.6%) was the lowest recorded in more than a quarter century"
  • "Less favorable prospects for the national economy were more frequently voiced by households with incomes in the top third"
  • "Regardless of income, consumers expect unemployment to edge slightly upward in the year ahead"

Preliminary Michigan Sentiment in December at 91.8, up 0.5 points from the November estimate.


Looking closer at the relationship between Michigan Sentiment and household consumption:
The chart below plots the 3mma of Michigan Sentiment in the x-axis and real consumption (3mma, YoY) in the y-axis. The vertical black line shows the most recent monthly print. The expected growth rate of consumption based on the latest Sentiment reading would be close to 3.25%.

Perhaps even more important, the current level of Sentiment is compatible with consumption growth in the 2.25%-4.5% range, with a few outliers above this range and no episode of real consumption growth below 2% in the vicinity of the current level for Michigan Sentiment.


Inflation expectations at 2.6%.


US Univ. of Michigan Sentiment: consumer upbeat; inflation expectations remain at lowest rate ever recorded

Posted on November 13th, 2015

Main takeaways:
  • Preliminary Michigan Sentiment in November at 93.1, up 3.1 points from the October estimate.
  • This was largely due to a stronger outlook for the domestic economy.
  • The overall tone of the report was very positive (see quotes below). Current level of Sentiment is associated with real consumption growing at 3.5%.
  • Historical episodes show that real consumption grows in the 2.5%-4.5% range while Sentiment is near current levels.
  • 5-10y inflation expectation remained at the 2.5% level, the lowest rate ever recorded.


Additional highlights in the report:
  • "The largest gains were among households with incomes in the bottom two-thirds of the distribution"
  • "Sentiment gain among households with incomes in the top third rose marginally"
  • "Buying plans for large discretionary purchases improved"
  • "Six-in-ten consumers expect interest rates to increase in the months ahead; that proportion has not increased in the past few months"
  • "Assessments of current personal finances improved in early November"
  • "For the second month, consumers anticipated an annual long term inflation rate of 2.5%, which ties the lowest rate ever recorded"
  • "The decline in the near term inflation rate appears to have been due to consumers finally becoming less skeptical that gas prices will actually remain at current lows in the year ahead"
  • "Consumers reported more positive economic developments in early November, primarily about gains in employment, as well as fewer negative reports about domestic stocks, the global economy and international trade"
  • "The majority of consumers anticipated that good times would persist uninterrupted by any downturns over the next five years"

Preliminary Michigan Sentiment in November at 93.1, up 3.1 points from the October estimate.


Looking closer at the relationship between Michigan Sentiment and household consumption:
The chart below plots the 3mma of Michigan Sentiment in the x-axis and real consumption (3mma, YoY) in the y-axis. The vertical black line shows the most recent monthly print. The expected growth rate of consumption based on the latest Sentiment reading would be close to 3.5%.

Perhaps even more important, the current level of Sentiment is compatible with consumption growth in the 2.5%-4.5% range, with a few outliers above this range and no episode of real consumption growth below 2% in the vicinity of the current level for Michigan Sentiment.


Inflation expectations remained at 2.5%, the lowest rate ever recorded (touched briefly in Sep/2002)


US October ISM Manufacturing preview: regional PMIs suggest a small upside risk vs bloomberg consensus

Posted on October 30th, 2015

Bottom line: the average of forecasting models suggest October ISM Manufacturing at 50.6, a bit above market consensus of 50.0. Looking only at the regional PMIs suggest ISM @50.5.

With all the key regional PMI's and the flash Markit PMI already released let's take a look at what can be inferred for the ISM. The chart below plots the ISM against the first principal component of all the remaining PMI's (also adding the GSAI - Goldman Sachs Analyst Index). It suggests October ISM at 50.5, a bit above market consensus.

Expanding the analysis, one can torture the numbers to come up with several competing forecasting models. This can range from simple Box-Jenkins and univariate time series filters to models using the principal components of regional PMI's and a mix of both.

Important to note that a simple random-walk forecast for the ISM Manufacturing is very competitive in terms of the measures of forecasting accuracy.

The literature on forecasting often suggest that combining different forecasting models produces, on average, better forecasts -- so let's give it a try.

Table below show the average point forecast for June's ISM Manufacturing as well as the range of point forecasts provided by the models I've tried.
Important: do not confuse this range with forecasting uncertainty; the error margins of the forecasting models are well wider than what is implied in the range of point forecasts.


Average forecastPoint forecast rangeBloomberg surveyBloomberg rangeActual
Sep 201459.158.3-60.658.557.0-60.056.6
Oct 201457.456.5-60.256.255.0-58.659.0
Nov 201458.057.2-59.058.054.5-61.058.7
Jan 201554.352.9-55.654.552.0-56.553.5
Mar 201552.149.6-52.952.549.5-55.051.5
Apr 201551.450.2-52.452.050.3-54.051.5
May 201551.149.6-52.352.050.0-52.5
52.8
Jun 2015
53.051.4-53.953.252.0-55.0
53.5
Oct 2015
50.6
50.1-52.3
50.0
48.9-51.5


US Univ. of Michigan Sentiment: inflation expectations at lowest rate ever recorded

Posted on October 30th, 2015

Main takeaways:
  • Final Michigan Sentiment in October at 90.0, down 2.1 points from the preliminary estimate.
  • This was largely due to less favorable assessments of buying conditions (due to fewer discounts).
  • The overall tone of the report was very positive (see quotes below).
  • Historical episodes show that real consumption grows in the 2.5%-4.0% range while Sentiment is near current levels.
  • 5-10y inflation expectation ticked down to 2.5%, the lowest rate ever recorded.


Additional highlights in the report:
  • "Confidence retreated in late October largely due to less favorable assessments of buying conditions"
  • "Largest gain was among households in the bottom third of the income distribution"
  • "Future financial prospects were viewed more favorably by all households than anytime since 2007"
  • "Consumers remain sensitive to pricing, with small decline in buying plans since mid month due to fewer price discounts than had been anticipated"
  • "Consumers voiced a somewhat greater willingness to use savings and debt to make major purchases"
  • "Net income gains were reported by the highest number of households with incomes in the bottom third in the past ten years"
  • "Households expressed a degree of financial optimist unseen since mid-2007"
  • "Two-thirds of all consumers reported hearing news of negative economic developments in early October, unchanged from September"
  • "News of job losses were reported slightly more frequently than job gains, the weakest in more than a year"
  • "October's 2.5% long term inflation rate ties the lowest rate ever recorded"

The final reading for October's Univ. of Michigan Sentiment rebounded from September (90.0 vs 87.2).


Looking closer at the relationship between Michigan Sentiment and household consumption:
The chart below plots the 3mma of Michigan Sentiment in the x-axis and real consumption (3mma, YoY) in the y-axis. The vertical black line shows the most recent monthly print. The expected growth rate of consumption based on the latest Sentiment reading would be close to 3.1%.

Perhaps even more important, the current level of Sentiment is compatible with consumption growth in the 2.5%-4.0% range, with a few outliers above this range and no episode of consumption growth below 2% in the vicinity of the current level for Michigan Sentiment.


Inflation expectations ticked down to 2.5%, the lowest rate ever recorded (since Sep/2002)


US CB Consumer Confidence drops in October, but still implies a healthy consumption growth

Posted on October 27th, 2015

Main takeaways:
  • Conference Board consumer confidence dropped 5 points to 97.6 in October.
  • Consumers' perception of the employment conditions worsened in October, but it is still above the level observed in the second half of 2014 -- a period where employment growth was booming.
  • Consumers’ optimism about the short-term outlook dropped 2.8 points to 88. It often leads consumption growth...
  • ...but despite the current slowdown, CB expectations index is associated with a healthy 2.6% real growth in consumption.

The Conference Board Consumer Confidence Index reading for October dropped 5 points to 97.6. Despite the monthly drop, the level of consumer confidence appears to have stabilized at a relatively high level.


Consumers perception of the employment conditions also worsened in October.
Less consumers think jobs are plentiful...

...and more find jobs are harder to get...

... but the overall employment condition is still above the level observed in the second half of 2014 -- a period where employment growth was booming.

Consumer expectations off the highs and may have turned down...

...but the present situation index does not seem to have topped.

Consumers’ optimism about the short-term outlook often leads consumption growth...

...but despite the current slowdown, CB expectations index is associated with a healthy 2.6% real growth in consumption.


Latest CFNAI print suggests GDP running just above 2%

Posted on October 26th, 2015

Filtering US GDP noise using CFNAI

Main takeaways:
  • “Potential" GDP growth (the one associated with CFNAI at zero) is close to 2.7% using the sample since 1985.
  • Latest CFNAI reading of -0.09 in Sep/2015 is usually associated with GDP growth at 2.3%.

Introduction

The Chicago Fed publishes monthly the CFNAI - Chicago Fed National Activity Index, and index designed to gauge overall economic activity and inflation pressure.

The CFNAI is a weighted average of 85 monthly indicators of economic activity, covering four broad categories: production and income; employment; personal consumption & housing; and sales, orders & inventories. A complete list of the variables included can be seen here. The CFNAI is the first principal component (common trend) of the 85 time series.

The CFNAI is constructed to have an average value of zero and a standard deviation of one. A positive reading means the economy is growing above trend. The 3-month moving average of the index is often used to filter monthly noise. According to Chicago Fed research, moving from an expansion period to a reading below -0.7 suggests a recession has begun. A reading above +0.2 suggests the recession has ended, and above +0.7 suggests a period of sustained increasing inflation has begun.

The chart below shows the CFNAI from Mar/1967 to Sep/2015.

The CFNAI has a positive correlation with GDP growth. The chart below shows that GDP trend growth (as measured by a CFNAI at zero) is around 2.8% for the full sample (when based on a linear regression). When looking at a local linear regression (loess) model, GDP trend growth is estimated at 2.7%, and the latest CFNAI printed -0.09 (3mma, Sep/2015) is associated with GDP growth at around 2.5%.

Checking for parameter stability

Formal tests for structural breaks in the relationship between GDP growth and CFNAI (not shown) do not suggest a statistically significant break in the parameters,i.e., the GDP growth rate equivalent to CFNAI at zero can be assumed constant for the whole sample period.


One way to illustrate that is to plot the intercept \(\alpha\) for the rolling linear regression \(GDP_t = \alpha + \beta \times CFNAI_t + \epsilon_t\) starting with the first 10 years of data up to the most recent quarter. The dotted lines represent one standard deviation of the coefficient estimate and show that there’s no structural break in the coefficient \(\alpha\). However, there is a (not statistically significant) jump in the intercept by mid-1980s, which coincides with the period when inflation finally moderated after the oil shock.

Using data since 1985


The chart below plots CFNAI and GDP growth restricting the sample to start in 1985. GDP trend growth (as measured by a CFNAI at zero) is around 2.8% for the sample since 1985 (when based on a linear regression). When looking at a local linear regression (loess) model, GDP trend growth is estimated at 2.7% in the same period. The latest print of CFNAI is associated with GDP growth at around 2.3% (chart).

Using data since 2000

Restricting the sample to start in 2000 we obtain:


GDP trend growth (as measured by a CFNAI at zero) is around 2.5% for the sample since 2000 (when based on a linear regression). When looking at a local linear regression (loess) model, GDP trend growth is estimated at 2.4% in the same period. The latest print of CFNAI is associated with GDP growth at around 2% (chart).


Dr. Paulo Gustavo Grahl, CFA (2015-10-26)


JOLTS - chartpack (Aug-15): robust labor market

Posted on October 16th, 2015


Hires rate at a healthy level. Separations rate also trending up; separations include voluntary quits, layoffs, and others.

Assuming voluntary quits and others (e.g., retirement) are part of the 'normal' labor market, we can split the above chart into 'net' hires (i.e, hires minus quits and minus others) and layoffs:

There are 5.4 million job openings in the US...

...and 7.9 million unemployed

Quits ratio is high relative to layoffs.

No wonder some companies are having hard time finding people to work...

...despite paying higher wages and planning to continue to increase wages

Current job openings rate was, in the past, compatible with much lower unemployment rates...

...but the bulk of the difference is long-term unemployment; short term unemployment rate is close to the previous cycle low (2007); interestingly short-term unemployment rate seems to have stalled at current low levels.


Paulo Gustavo Grahl, CFA

Random comments on macro data. Views are my own. Except when they aren't.