Showing all posts tagged #trade:


Global trade volumes in January/2016

Posted on March 24th, 2016

Main takeaways:

  • World trade volumes resilient, despite risk-off in financial markets.
  • World trade volumes growing at around 1.8% per year, but with sharp contrast between advanced and emerging economies.
  • Advanced economies imports growing at a strong pace, but growth might have slowed a bit in recent months.
  • Trade volumes in emerging economies, on the other hand, are flat (but with some tentative sign of improvement in imports).

The Netherlands Bureau for Economic Analysis (CPB - Centraal Planbureau) has released world trade volume and industrial production data for January.

World trade prices (exports and imports) dropped materially since mid-2014, in tandem with oil prices. Trade prices fell by 45 % for advanced economies (AE), 60% for emerging economies, while oil prices dropped 120% in the same period ! (welcome to log % changes !!)

This has confused some pundits that often mention the collapse in global trade growth looking only at nominal (or current US$) trade performance. Looking at trade volumes one reaches a different conclusion (more on this below).


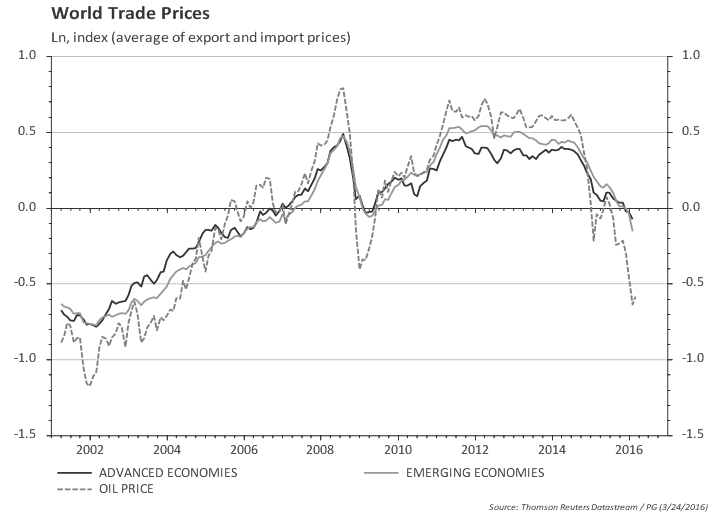
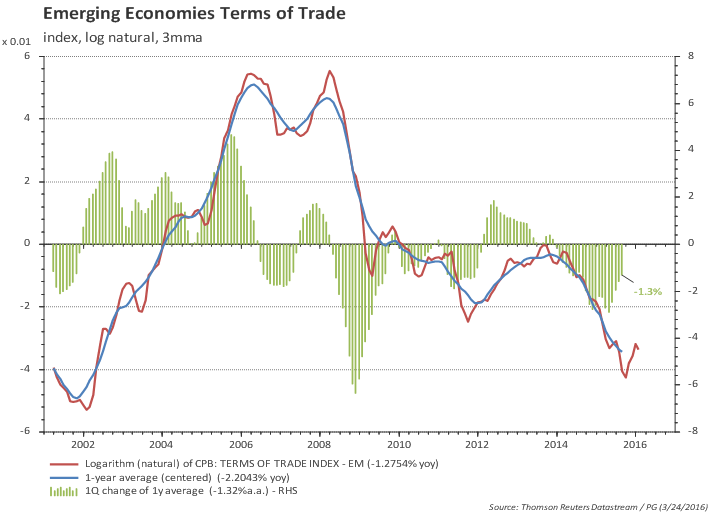
The overall drop in trade prices for both emerging and advanced economies masks an important difference: the regions faced opposite terms of trade shocks in recent years. Advanced economies are facing improving terms of trade, while EM economies are facing a declining terms of trade (but with a tentative sign of a rebound, see charts).
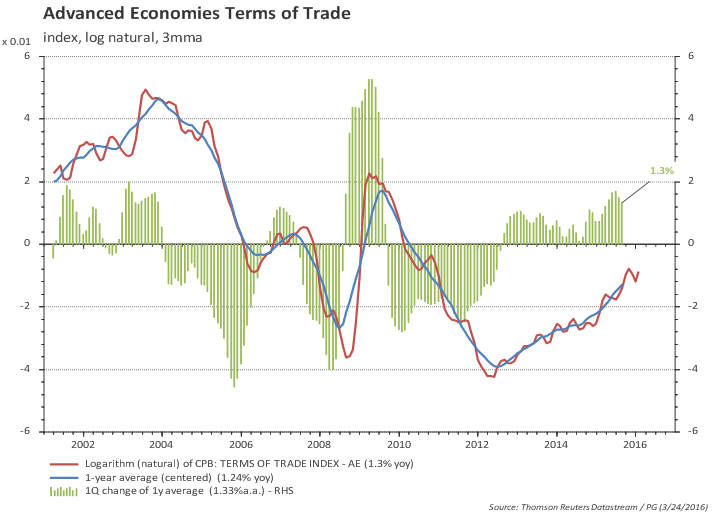


Advanced Economies
Looking at trade volumes, one can see that demand (imports) from advanced economies picked up late 2013 and is growing at a healthy 3.5% pace, but might have slowed a bit more recently.


Emerging Economies
Emerging economies show a completely different picture. Both export and import volumes have been relatively flat since mid-2014. More recently, imports are tentatively rebounding, but exports remain lackluster.


World
The consolidated world trade statistics show a puzzling divergence: consolidated imports (of which EM account for one-third) is growing at a healthy pace, while consolidated exports (of which EM account for 40%) are roughly flat. Growth of average trade volume is at 1% yoy, with imports growing at 2%yoy and exports flat.


Global industrial production and trade resilient despite tightening of financial conditions

Posted on February 26th, 2016

Main takeaways:

  • World trade volumes resilient, despite risk-off in financial markets.
  • World trade volumes growing at around 2.5% per year.
  • Global industrial production growing at 1%, but the recent slowdown in growth is due to US; ex. US, global IP is growing at 1.5%-2%.

The Netherlands Bureau for Economic Analysis (CPB - Centraal Planbureau) has released world trade volume and industrial production data for December.

Chart 1a) Volume of world trade (exports & imports, seasonally adjusted)


Chart 1b) Volume of world trade (seasonally adjusted)


The charts below zoom in to the most recent four years to highlight the behavior of trade volumes at margin.
Export trend growth in the last two years slowed from 2.4% to 2.1% (from July to September) but rose to 3.7% in December.
Import trend growth slowed from 1.8% to 1.6% (from July to September) but moved up to 2.2% in December.

Chart 2a) Volume of world exports (seasonally adjusted, last 4 years)


Chart 2b) Volume of world imports (seasonally adjusted, last 4 years)


Chart 2c) Volume of world imports ex ASIA (seasonally adjusted, last 4 years)


Chart 3a) World Industrial Production (seasonally adjusted)


Chart 3b) World Industrial Production ex US (seasonally adjusted)


Chart 3b) World Industrial Production (seasonally adjusted)


US External Trade likely to be a drag on growth again in Q4

Posted on January 6th, 2016

Main takeaways:
  • Net exports likely to be a drag on growth again (~0.4pp).
  • Real imports dropped in the last three months, but the trend in the last 12-months is still a healthy 4.6% growth pace.
  • Weak US exports hit by strong dollar and sluggish global trade.


Real non-petroleum exports are down 2% in Oct/Nov vs Q3 and imports are down 0.6% in the same comparison. Excluding petroleum, exports volume contracted by 1.6% and imports by 0.4%.

Trade results for October/November, if repeated in December, would lead to another negative contribution of external trade to growth of around 0.4pp. But negative contribution from external trade to growth, per se, does not imply overall GDP growth will be weak (see for instance the negative contributions from net exports to growth in the 1997-2005 period)

The charts below show the volumes of non-petroleum exports and imports. Exports volume is flat while imports volume is growing at around 5%.

Last 20 years (trend shows last 2 years)
Last 3 years (trend shows last 12 months)
YoY growth

The jump in import growth precedes the stronger USD and coincides with an upturns in job creation and consumption that happened in 2014 -- therefore not likely to be a strong consequence of the currency strength and import substitution (although it may play some role).
The slowdown in exports, however, happened at the turn of the year, and therefore could potentially be a quick response to the strenghtening of the dollar that started in mid-2014.

However, the chart below shows that US exports are moving roughly in tandem with world exports. US exports relative to world exports dropped since the start of 2015, but the size of the adjustment does not suggest that the dollar strengthening is playing a major role for weak US exports.

Of course it could be just a matter of time for US exports to shrink relative to world exports, but the recent weak performance seems more likely a result of sluggish world trade rather than dollar strength.

Meanwhile, the ISM export orders improved a bit but still do not suggest upside in the near term.


US External Trade: Net exports likely to be a drag again in Q4 (Oct/15)

Posted on December 4th, 2015

Main takeaways:
  • Net exports likely to be a drag on growth again.
  • US exports are not losing market share, despite dollar strengthening that started mid-2014.
  • Weak US exports more likely reflect sluggish global trade.


Trade results for October, if repeated in the next couple of months, would lead to a material drag in Q4 growth again. Note, however, that periods of consistent drag from net exports were also observed in the 1997-2005 period -- see chart.

Imports are growing at a strong pace and exports collapsed in the turn of the year and remained roughly flat since then.

The jump in import growth precedes the stronger USD and coincides with an upturns in job creation and consumption that happened in 2014 -- therefore not likely to be a strong consequence of the currency strength and import substitution (although it may play some role).
The slowdown in exports, however, happened at the turn of the year, and therefore could potentially be a quick response to the strenghtening of the dollar that started in mid-2014.

However, the chart below shows that US exports are moving roughly in tandem with world exports...yes US exports relative to world exports dropped since the start of 2015, but the relative level is only 1.5% below the trend since the crisis. This means that the recent strengthening of the dollar is not causing a loss of US market share in world (volume) exports.
Of course it could be just a matter of time for US exports to shrink relative to world exports, but the recent weak performance seems more likely a result of sluggish world trade rather than dollar strength.

Meanwhile, the ISM export orders do not suggest any upside in the near term.


World trade volumes remain sluggish

Posted on November 25th, 2015

Main takeaways:

  • World trade volumes rebounded after the slowdown earlier in the year.
  • But volumes are flat compared to last year.

The Netherlands Bureau for Economic Analysis (CPB - Centraal Planbureau) has released world trade volume data for September.

The charts below shows world trade volumes picking up a bit since the first quarter contraction, but the overall message is still of a very sluggish trade.

Chart 1a) Volume of world trade (exports & imports, seasonally adjusted)


Chart 1b) Volume of world trade (seasonally adjusted)


The charts below zoom in to the most recent four years to highlight the behavior of trade volumes at margin. Export trend growth in the last two years slowed from 2.4% to 2.1% (from July to September), while import trend growth slowed from 1.8% to 1.6% in the same comparison.

Chart 2a) Volume of world exports (seasonally adjusted, last 4 years)


Chart 2b) Volume of world imports (seasonally adjusted, last 4 years)


The breakdown by country/region show that export volumes from the Euro Area have been very resilient while export volumes fell in the other regions. Imports have rebounded in most regions in recent months.

Chart 3a) Export volumes by country / region (seasonally adjusted)


Chart 4b) Import volumes by country (seasonally adjusted)


Paulo Gustavo Grahl, CFA

Random comments on macro data. Views are my own. Except when they aren't.