Fed's criteria for raising rates:
"The Committee anticipates that it will be appropriate to raise the target range for the federal funds rate when it has seen further improvement in the labor market and is reasonably confident that inflation will move back to its 2 percent objective over the medium term."
So Fed needs to be reasonably confident inflation will move back to 2%. Are we there yet?
No. Recent Fed comments suggest the Fed is increasingly worried about downside risks to inflation (due to oil prices, strong dollar, slowdown in some recent economic data).
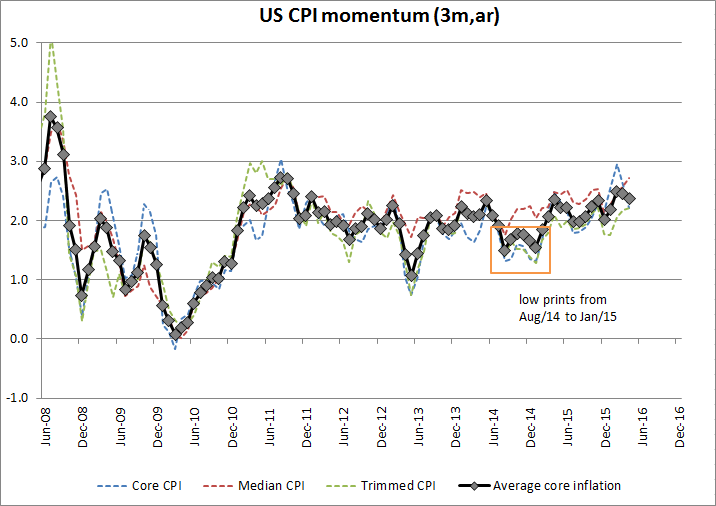
Consumer inflation is not there yet, but inflation momentum (3-month annualized inflation) is hovering around 2.0% in the last three months to September.
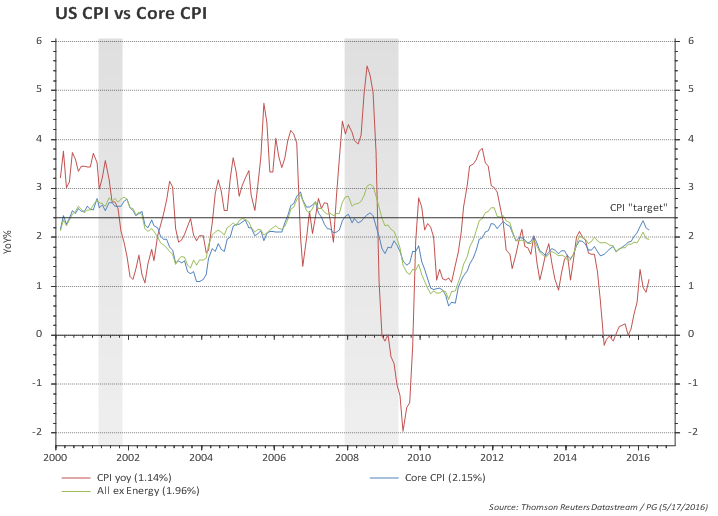
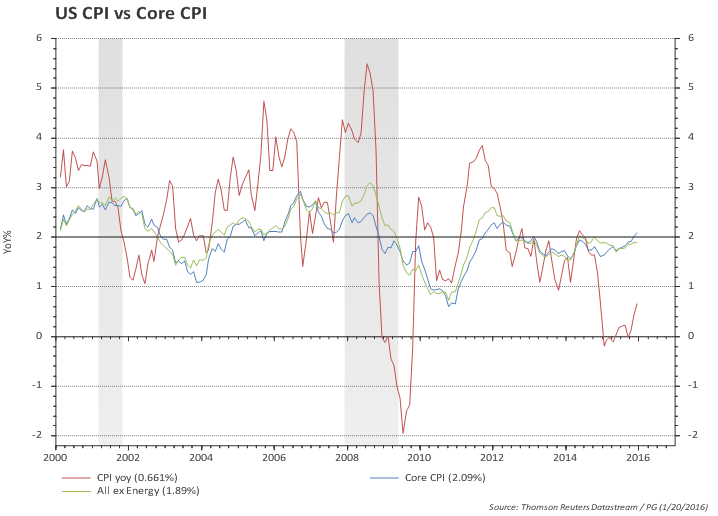
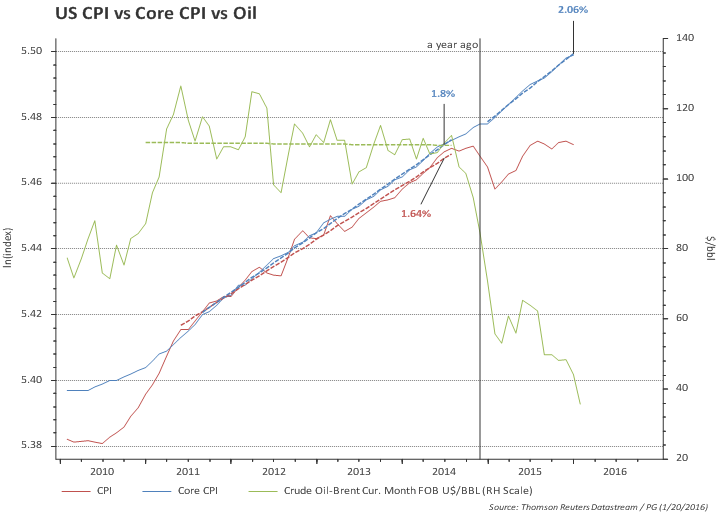
The chart below shows that CPI excluding energy is growing at 1.9% for 2 years -- with no sign of an impact of the stronger US dollar on overall price level. It is very hard to infer an slowdown in price increases from the chart below.
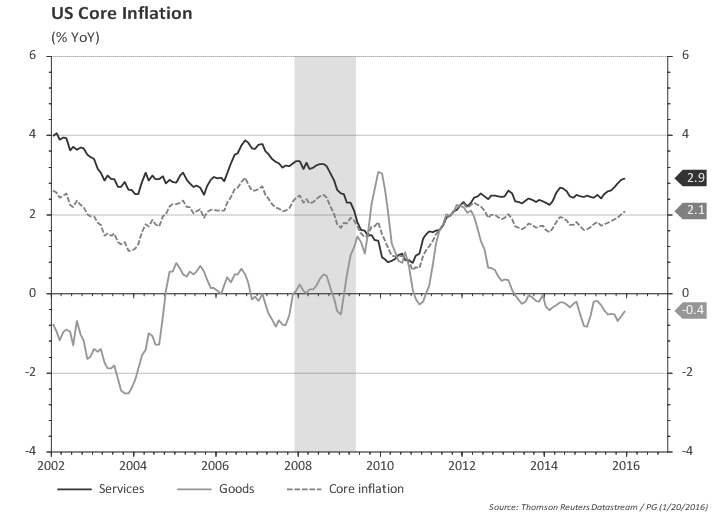
The reason for the steady pace of overall inflation (ex energy) is that services prices are increasing at a healthy 2.7% yoy (and 2.5% in the last 2 years). This is not far behind where core services were before the recession.
Housing prices (rental and OER) represents 33% of CPI and is increasing at 3.2% yoy.
See the detailed chart pack below.
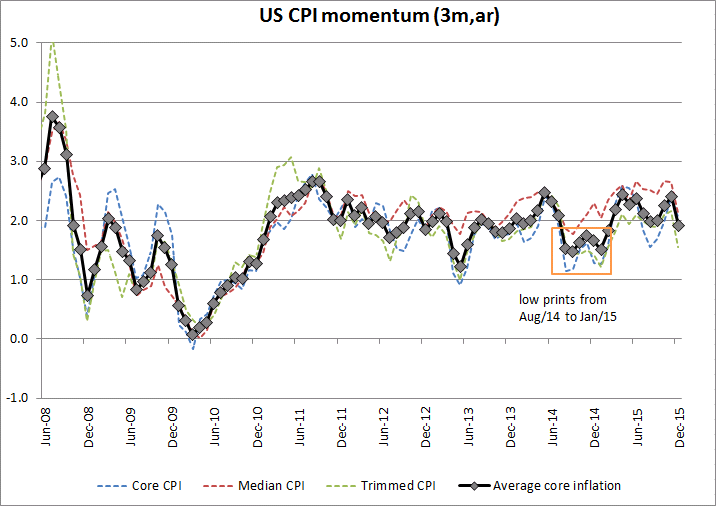
Core inflation momentum moved from 1.5% in Jan to 2.4% in June and down to 2.0% in September. (2% in the last three prints - July, August, September).
Trimmed-mean CPI -- mentioned in the minutes -- moved from 1.2% to 2.1% and then to 1.9% in the same comparison.
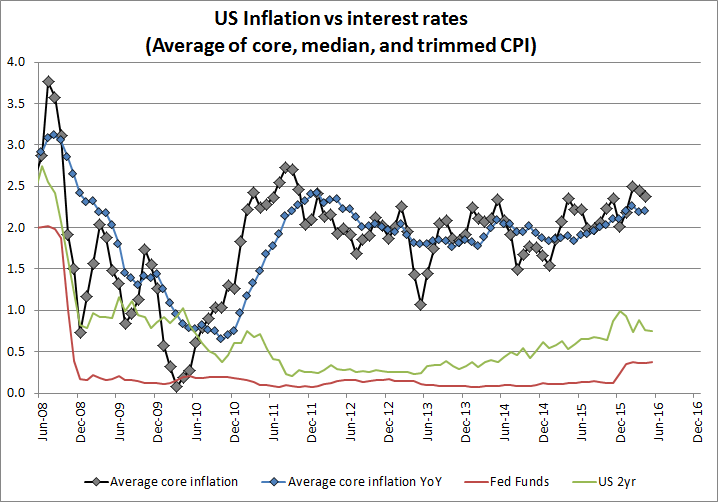
The chart below looks at the average of the three measures of core inflation over a longer time span. Despite all the talks of deflation / lowflation, annual core inflation has barely moved since late 2011.
Core CPI at 1.9% and CPI ex energy at 1.8%.
It's all about energy...
...and goods. Services inflation running at a healthy 2.7%
Oil prices are spilling over to core. Core inflation excluding airfares is a bit higher. Looking at this chart it is hard to understand the Fed's fears of inflation remaining low...
Gasoline prices down again
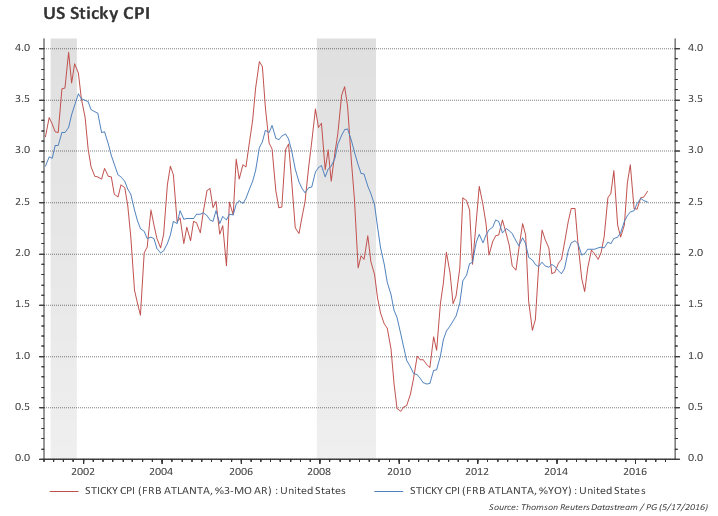
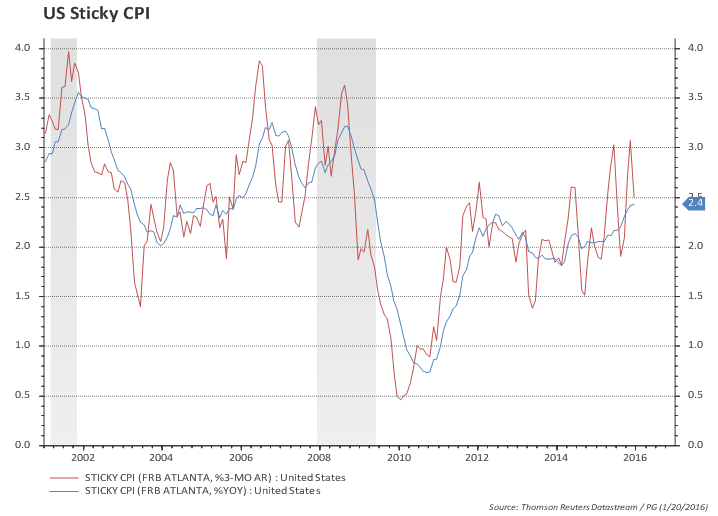
Sticky-Price CPI growth remains stable -- a sign of anchored expectations
The Atlanta Fed produces a breakdown between 'sticky' vs 'flexible' prices and they argue 'sticky' prices (which is a weighted basket of items that change prices relatively slowly) "appear to incorporate expectations about future inflation to a greater degree than flexible prices".
The chart below shows that 'sticky' prices remain...well, sticky at around the 2% level annually. Moreover, sticky prices inflation is down but is running very close to 2%. This is in clear contrast to the 2009 to 2011 period which clearly showed concerns about future inflation.
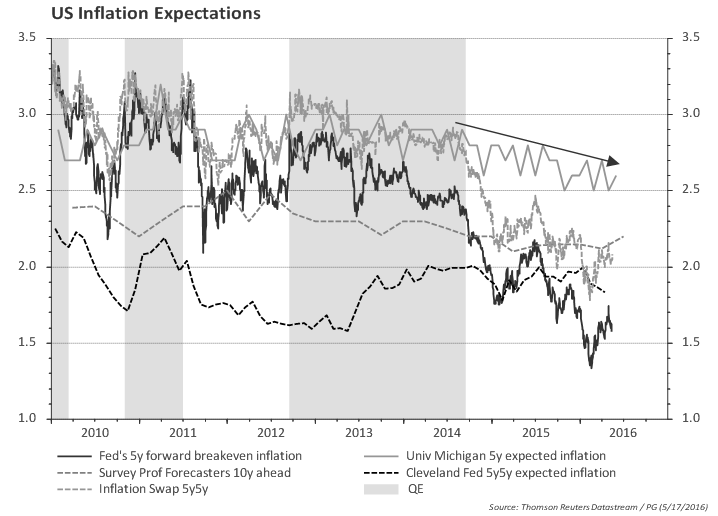
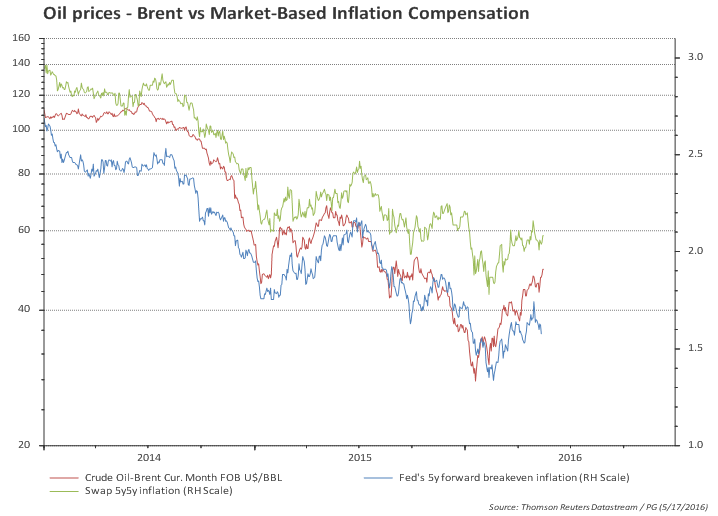
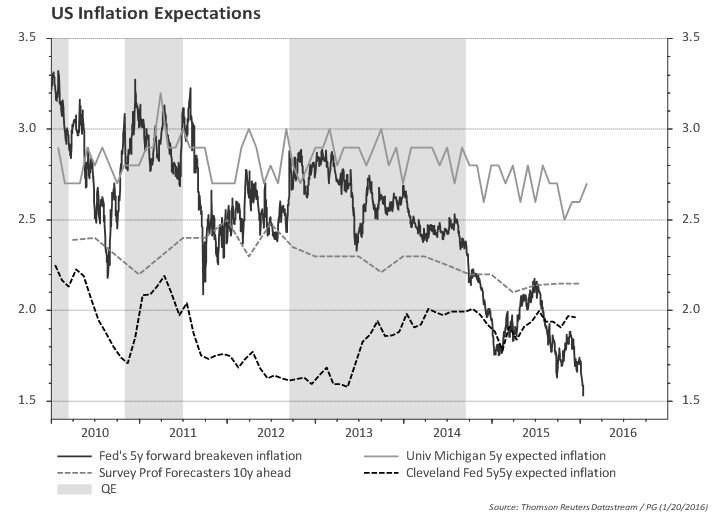
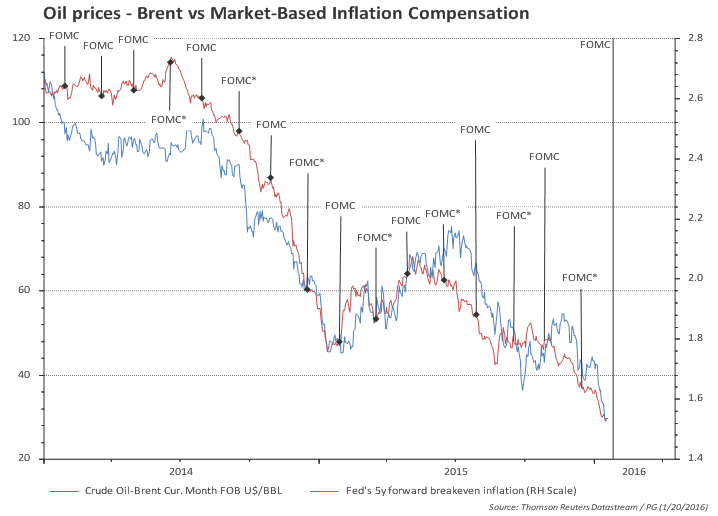
Market-based inflation compensation is falling...this moves with oil prices and FOMC decided to downplay this by move late 2014.