Showing all posts tagged #labour-markets:


US April/16 Payroll: net job creation slowed down

Posted on May 6th, 2016

Main takeaways:

  • Net job creation slowed down, as suggested by a mix of labor market data ('labor market conditions').
  • Monthly payroll changed from being 'surprisingly resilient' to being 'disappointing'.
  • While one should have expected the pace of job creation to slowdown, April's result can be traced back to 'construction', 'retail sales' and 'government' categories.
  • Looking at the overall trend in those categories, one would hardly be too worried abut the weak prints in April.
  • Also, hours worked and average hourly earnings posted healthy gains in April.
  • Wage growth has steadily increased since early 2015; the Phillips curve seems to be alive and well.
  • The household survey showed a 316 thousands loss of jobs in April; but this was on the back of an average gain of 464 thousands in the first quarter.
  • Despite the loss of jobs, unemployment rate remained stable at 5% since participation rate gave back part of the previous gains (from 63% to 62.8%).


Most people were surprised job creation was very resilient to the tightening of financial conditions and the GDP slowdown.
Now, most people are disappointed by the slowdown in April's payroll...go figure!


Establishment Report
Net job creation in the private sector slowed from about 230k per month in the second half of 2015 to 183k/month in the first four months of 2016. This should not be a major surprise. Indeed, my own track of labor market conditions suggested "underlying private payroll running at around 170 / 183 thousands/month". (See "US Labor Market Conditions").

The chart below shows the evolution of the 6-month payroll average in real time. It shows an uptrend in the second half of 2015 that was at odds with the tightening of financial conditions observed in the same period.


To be fair, the reason for concern / disappointment is probably more linked to the fact that, when looking at divergent signs (employment pickup vs growth slowdown) some observers were putting more emphasis on the more upbeat employment date -- an emphasis that several Fed members often also give in their own speeches.

But specifically for April, we can trace the slowdown in private job creation to construction and retail sales. Construction added, on average, 36 thousand jobs per month in 4Q 15 / 1Q 16 and April reported a mere 1k increase. Similarly, retail sales added 40 thousands per month in 4Q/1Q and April printed minus 3k.

The following two charts plot the employment level in retail and construction, as well as the trend in the last two years and the last 12 months (orange bars show monthly changes). One can hardly see a problem in those employment groups.


Also, the weakness in the establishment report was confined to the headline payroll number, since both hours worked and wages increased in the month. Total hours worked rose a healthy 0.4% in April (for production workers) and now stand at 1.6% above the first quarter average level. This is not great, but compares favorable to the first quarter (1.2%) and to sub 2% GDP growth estimates for the second quarter.


Average hourly earnings also posted a strong 0.3% mom growth in April, leading to 2.5% growth compared to a year ago. But what is more striking, in my view, is that wage growth has steadily increased since early 2015 at the same time that most pundits complain that wages are not going anywhere. The chart below shows the Phillips curve seem to be well and alive: wage growth starts to increase following two years of very strong job growth (2014 and 2015) and with unemployment rate very close to NAIRU.


Total (nominal) labor income rose a strong 0.7% mom in April, but the carry over for the second quarter is a mere 3.3% for production workers and 3.7% for all employees. With rising inflation, this means real purchasing power is going down. Consumers would have to tap their (increasing) savings if consumption is expected to rebound from the weak first quarter.


Household Report
The household report is often very volatile in a monthly basis, but it painted a weaker picture with net job losses of 316 thousands in the month. Truth be told, the household report had shown an average gain of 464 thousands per month in the first quarter. Indeed, even with April's losses, the average 2016 employment gain in the household report stands at 270k/month.

Despite the losses in the month, unemployment rate remained flat at 5% due to a 362 thousand drop in the labor force. Participation rate dropped from 63% to 62.8% and remains close to the level observed in 2014 and early 2015. The pick-up in LFPR since last September has confused many observers and there is no clear reason why that has happened; contrary to often stated views, the pick up does not seem to be due to more people joining the labor force in response to a strong labor market. It is very difficult to have confidence in a short term forecast of LFPR but, over the years, demographics should dominate short-term fluctuations leading to lower participation in the coming years.

If one assumes labor participation remains flat at current levels, then a monthly job creation of 175k would lead to unemployment rate at 4.6% by the end of the year.


The charts below show employment to population ratio and the broader U6 unemployment rate.


April employment by category

Posted on May 6th, 2016

April employment by category

The charts below show employment by category. The blue line is total employment in the category, the orange bar is monthly change and the red line is the linear regression in the last two years and in the last one year.

Total payroll increased 160k in April, after a 208k growth in March (which was revised down from 215k). The trend for the last 6 months slowed from 260k/month by the end of 2014 to 237k in the 6 months to December/15 to 220k in the 6 months to April/16.

Private payroll increased 171k in April, after 184k growth in March (revised down from 195k). The trend for the last 6 months slowed from 250k/month by the end of 2014 to 229k in the 6 months to December/15 to 212k in the 6 months to April/16.

Most of the slowdown in the pace of job creation was concentrated in the goods producing sector (mining and manufacturing); construction jobs are doing ok and the the services sector has, so far, not being affected by manufacturing slowdown. Overall, the 6-month pace of job creation in the goods sector slowed from 50k (at the end of 2014) to close to 18k at the end of 2015 and 16k by Apr/16, while in the services sector it slowed from 200k to 211k to 195k in the same comparison.

Full set of charts in the link: http://bit.ly/us-payroll-category-apr16

US March/16 Payroll: resilient labor market

Posted on April 1st, 2016

Main takeaways:

  • Labor market surprisingly resilient: services unabated by manufacturing slump.
  • But the weakness in manufacturing hours/employment needs to be seen in the context of an incipient rebound in US manufacturing activity (ISM bottomed in February).
  • Wage trend appears to be unchanged (not slowing down, but not speeding up either).
  • Unemployment rate has stabilized at the top of Fed’s NAIRU.
  • The 6-month increase in participation rate is big; last time it happened was 1992.
  • Well-behaved wages and increase in labor supply takes the pressure off the Fed (less ammunition for the hawks).
  • BUT that does not mean the markets are right! Mkt consensus is even more dovish than Yellen – something that does not make much sense in the face of strong labor market, rebound in manufacturing, strong consumer confidence, easing of financial conditions, firming of inflation.

Charts and more details: http://bit.ly/us-payroll-mar16


US December employment by category

Posted on January 11th, 2016

December employment by category

The charts below show employment by category. The blue line is total employment in the category, the orange bar is monthly change and the red line is the linear regression in the last two years.

Total payroll increased 292k in December, after a 252k growth in November (which was revised up from 211k). The trend for the last 6 months slowed from 280k/month by the end of last year to 229k in the 6 months to December.

Private payroll increased 275k in December, after 240k growth in November (revised up from 197k). The trend for the last 6 months slowed from 270k/month by the end of last year to 219k in the 6 months to December.

Most of the slowdown in the pace of job creation was concentrated in the goods producing sector (mining and manufacturing); construction jobs are doing ok and the the services sector has, so far, not being affected by manufacturing slowdown. Overall, the 6-month pace of job creation in the goods sector slowed from 50k (at the end of last year) to close to 17k, while in the services sector it slowed from 220k to 202k in the same comparison.

Employment categories

  • Total nonfarm
    • Total private
      • Goods-producing
        • Mining and logging
        • Construction
        • Manufacturing
      • Private service-providing
        • Trade, transportation, and utilities
          • Wholesale trade
          • Retail trade
          • Transportation and warehousing
          • Utilities
        • Information
        • Financial activities
        • Professional and business services
          • Temporary help services
        • Education and health services
          • Educational services
          • Health care and social assistance
        • Leisure and hospitality
        • Other services
    • Government

Charts

Total nonfarm (trend from 242.1 to 241.7 to 243.3/m)

Total private (trend from 235.0 to 234.5 to 235.5/m)

Goods-producing (trend from 32.4 to 30.4 to 28.9/m)

Mining and logging (trend from -1.5 to -2.0 to -2.3/m)

Construction (trend from 21.8 to 21.7 to 21.8/m)

Manufacturing (trend from 13.0 to 12.0 to 11.2/m)

Private service-providing (trend from 202.6 to 204.1 to 206.7/m)

Wholesale trade (trend from 7.8 to 7.5 to 7.3/m)

Retail trade (trend from 23.9 to 24.2 to 23.9/m)

Transportation and warehousing (trend from 12.1 to 11.4 to 11.5/m)

Utilities (trend from 0.7 to 0.8 to 0.8/m)

Information (trend from 3.8 to 3.9 to 4.2/m)

Financial activities (trend from 11.8 to 12.2 to 12.4/m)

Professional and business services (trend from 54.2 to 54.4 to 54.9/m)

Temporary help services (trend from 11.7 to 11.2 to 11.1/m)

Educational services (trend from 4.1 to 4.4 to 4.6/m)

Health care and social assistance (trend from 40.9 to 42.3 to 43.8/m)

Leisure and hospitality (trend from 37.1 to 37.3 to 37.5/m)

Other services (trend from 6.1 to 5.8 to 5.8/m)

Government (trend from 7.1 to 7.2 to 7.7/m)


Dr. Paulo Gustavo Grahl, CFA (2016-01-11)


US November employment by category

Posted on December 4th, 2015

November employment by category

The charts below show employment by category. The blue line is total employment in the category, the orange bar is monthly change and the red line is the linear regression in the last two years.

Total payroll increased 211k in November, after a 298k growth in October (which was revised up from 271k). The trend for the last 6 months slowed from 280k/month by the end of last year to 213k in the 6 months to November.

Private payroll increased 197k in November, after 304k growth in October (revised up from 268k). The trend for the last 6 months slowed from 270k/month by the end of last year to 201k in the 6 months to November.

Most of the slowdown in the pace of job creation was concentrated in the goods producing sector (mining and manufacturing); construction jobs are doing ok and the the services sector has, so far, not being affected by manufacturing slowdown. Overall, the 6-month pace of job creation in the goods sector slowed from 50k (at the end of last year) to close to zero, while in the services sector it slowed from 220k to 194k in the same comparison.

Employment categories

  • Total nonfarm
    • Total private
      • Goods-producing
        • Mining and logging
        • Construction
        • Manufacturing
      • Private service-providing
        • Trade, transportation, and utilities
          • Wholesale trade
          • Retail trade
          • Transportation and warehousing
          • Utilities
        • Information
        • Financial activities
        • Professional and business services
          • Temporary help services
        • Education and health services
          • Educational services
          • Health care and social assistance
        • Leisure and hospitality
        • Other services
    • Government

Charts

Total nonfarm (trend from 242.7 to 242.1 to 241.7/m)

Total private (trend from 235.6 to 235.0 to 234.5/m)

Goods-producing (trend from 34.8 to 32.4 to 30.4/m)

Mining and logging (trend from -1.1 to -1.5 to -2.0/m)

Construction (trend from 22.4 to 21.8 to 21.7/m)

Manufacturing (trend from 14.1 to 13.0 to 12.0/m)

Private service-providing (trend from 200.8 to 202.6 to 204.1/m)

Wholesale trade (trend from 7.9 to 7.8 to 7.5/m)

Retail trade (trend from 24.0 to 23.9 to 24.2/m)

Transportation and warehousing (trend from 12.4 to 12.1 to 11.4/m)

Utilities (trend from 0.7 to 0.7 to 0.8/m)

Information (trend from 3.9 to 3.8 to 3.9/m)

Financial activities (trend from 11.6 to 11.8 to 12.2/m)

Professional and business services (trend from 53.7 to 54.2 to 54.4/m)

Temporary help services (trend from 11.9 to 11.7 to 11.2/m)

Educational services (trend from 4.2 to 4.1 to 4.4/m)

Health care and social assistance (trend from 39.1 to 40.9 to 42.3/m)

Leisure and hospitality (trend from 37.1 to 37.1 to 37.3/m)

Other services (trend from 6.2 to 6.1 to 5.8/m)

Government (trend from 7.0 to 7.1 to 7.2/m)


Dr. Paulo Gustavo Grahl, CFA (2015-12-04)


US November Payroll: changing the focus to the pace of rate increases...

Posted on December 4th, 2015

Main takeaways:

  • Yellen's speech at the Economic Club of Washington on Dec 2 explained why she will vote for an increase in rates on December 16. There's nothing in today's job report that would make her change her mind.
  • A couple of months ago I took the view Aug/Sept plunge in job creation would reverse in time for a December liftoff: "Since I believe the payroll slowdown is temporary and that global risks are likely to recede in the coming months, I think December is still the most likely date for moving out of the ZLB". That's now a consensus.
  • The focus will now shift to the pace of increase thereafter, as the Fed wishes:
    • "what matters for economic outlook are the public's expectations concerning the path of the federal funds rate over time" (Yellen speech).
  • But FOMC expected, in September's projections, around 100bp increase / year in the next couple of years; market expects, on average, around 50-60bp per year. The FOMC could move a bit towards markets in the next meeting, but the gap will remain large.
  • The risk of a very short hiking cycle is not trivial; but, barring a China colapse, I think odds are both the Fed and the markets will adjust expectations upwards by mid H1 2016.

Establishment report:

Private payroll increased 197k in November, in line with the bloomberg consensus. Net revisions were positive 52k.

The table below shows the expected range for private payroll (excluding outliers), the monthly surprise and revisions to the last 3 months. The actual print is in "red" (an "x" when inside the expected range and a box when outside).

It is interesting to see the shape of the gray area! The negative surprises in August and September led to a material downward change in market's expected range for private payroll. A positive surprise in October resulted in an opposite move.


Market has been on track forecasting the pace of job creation in the last 6 months!
(but actual number beat forecast in the last 3 months)
One can see that the average of the median expectations for the last 12 months was 212k/month, very close to the actual releases of 213k/month in the same period (after revisions, private payroll averaged 212k/month in the last 12 months).

In the last 6 months the median expectations averaged 201k/months and the actual release averaged 193k (201k/month after revisions).

In the last 3 months the median expectations averaged 188k/m and the actual release averaged 194k/month (222k/month after revisions).

Payroll trend
The trend in private payroll (measured by the 12-month moving average) moved down to 212k/month from 226k/month (unrevised) in October. The chart below shows the current vintage (orange line) as well as the real time path observed in each of the last few months.

It is clear that the pace of job creation has slowed from the excessively high pace observed in Q4 2014 and Q1 2015, but it is still well above the job growth observed in 2013 / early 2014.


The chart below shows that annual growth rate in private payroll is growing at 2.1% yoy -- off the highs but is still a healthy pace of growth.


Job growth momentum is back to neutral after spending Q2 and Q3 in the negative area.

Labor input:

The volume of total hours worked in the economy recovered from September and is back on the trend since 2009. Total hours worked increased 2.2% (annualized) in the last 3 months (blue line in the chart below).


Hours worked in the goods sector have been roughly flat in 2015. Hours worked in the services sectors continued performing well.


Wages:

Wages for all employees rose by 2.3% yoy (vs 2.4% in October) and for production worker rose 2% yoy (vs 2.2% in October). Overall, as the chart below shows, average hourly earnings have consistently grown at about 2.1% p.a in the last three years.


Household income:

Good. Close to the trend observed in the last three years.


Goods sector nominal income below trend.

Services sector income close to trend.


Household report:

The labor force participation rate ticked up in November (to 62.5% -- see chart).
It is interesting to highlight that the most LFPR managed to do was to stabilize in 2014 -- a year in which job creation and labor market conditions improved quite substantially. If the LFPR resumes its structural downtrend it could put the Fed in a position where they see labor slack shrinking faster than what they forecast, despite a similar economic growth outlook.

The broader measure of unemployment (U-6), which includes marginally attached, discouraged workers, and employed part time for economic reasons move slightly up in November, but overall it is falling faster than the headline unemployment.

The median forecast for unemployment rate in the Fed's SEP (Summary of Economic Projections) is 4.8% for 2016, 2017 and 2018. Assuming a flat LFPR, a forecast of 4.8% unemployment rate by the end of 2016 is compatible with average employment growth of 145k/month, substantially lower than the current pace of job growth.


As a reference, even a slowdown in employment growth from 2.1% currently to 1.5% yoy (the floor observed since mid-2011 was 1.8% yoy) would be equivalent to monthly employment gains of 178k and this would lead to a 4.4% unemployment rate by the end of 2016. Bottom line: LFPR needs to rebound (or job creation to settle at a very low level) for a 4.8% unemployment forecast to be attainable.

See detailed charts below:


The chart below shows unemployment rate (and short-term unemployment) and the recent tightening cycles (yellow). The short-term unemployment rate is at the lows.

Long term unemployment rate is improving faster. Moreover, the 'shadow' labor (i.e., the gap between U-6 and the headline unemployment rate) is also improving faster in the recent months. This is a clear sign that the labor market continues improving.


US October Payroll: Phew!

Posted on November 6th, 2015

Main takeaways:

  • Very strong report, across the board; 268k jobs were created in the private sector, and Aug/Sep job gains were revised up by 56k.
  • Weak job creation in August / September raised concerns about the health of the economy, but the October report seems to confirm my take that labor market was not as weak as portrayed by the previous two reports (see US labor market conditions suggest job creation higher than observed in Aug/Sep).
  • The pickup in wage growth (0.4% mom and 2.5% yoy) may be a reminder that the Phillips Curve is not dead.
  • Measures of labor slack kept shrinking, particularly those measures Yellen likes to focus (e.g., part time for economic reasons, marginally attached,...).
  • Particularly worrying is the decline in labor force participation (LFPR), which seems to be heading down after a brief respite.
  • If LFPR remains flat a mere 135k/month payroll for the next 14 months is needed to reach the 2016 median unemployment forecast.
    • Job growth above 135k/month or falling labor force will result in unemployment rate undershooting Fed's forecasts.
  • If employment growth slows from the current 2.3% to 1.5% yoy and LFPR remains constant (against structural trend), then unemployment rate would reach 4.4% by the end of 2016.
  • Allowing the LFPR to continue its down trend since 2010, 135k/month would lead unemployment rate to 4.0% by the end of 2016!
  • As for the timing of liftoff... last month I wrote: "Since I believe the payroll slowdown is temporary and that global risks are likely to recede in the coming months, I think December is still the most likely date for moving out of the ZLB". That remains the case since the October report confirmed my previous beliefs.

Establishment report:

Private payroll increased 268k in October, well above the bloomberg consensus. Net revisions were positive 56k.

The table below shows the expected range for private payroll (excluding outliers), the monthly surprise and revisions to the last 3 months. The actual print is in "red" (an "x" when inside the expected range and a box when outside).

It is interesting to see the shape of the gray area! The negative surprises in August and September led to a material downward change in market's expected range for private payroll.


Market has been on track forecasting the pace of job creation in the last 6 months!
One can see that the average of the median expectations for the last 12 months was 215k/month, very close to the actual releases of 223k/month in the same period (after revisions, private payroll averaged 226k/month in the last 12 months).

In the last 6 months the median expectations averaged 205k/months and the actual release averaged 204k (201k/month after revisions).

In the last 3 months the median expectations averaged 190k/m and the actual release averaged 175k/month (181k/month after revisions).

Payroll trend
The trend in private payroll (measured by the 12-month moving average) moved up to 226k/month from 217k/month (unrevised) in September. The chart below shows the current vintage (orange line) as well as the real time path observed in each of the last few months.

It is clear that the pace of job creation has slowed from the excessively high pace observed in Q4 2014 and Q1 2015.


The chart below shows that annual growth rate in private payroll is growing at 2.3% yoy -- off the highs but is still a healthy pace of growth.


The current yoy growth (2.3%) continues very close to the growth observed in private payroll in the last 3 years, which is above the peak observed in March/2006 during the previous expansion period and is closer to the growth rate observed in the late 1990´s.

Labor input:

The volume of total hours worked in the economy increased in October recovering from September drop and seems to be back on the trend ince 2009. Total hours worked increased 1.8% (annualized) in the last 3 months (blue line in the chart below).


The recovery in hours worked was mostly due to the goods sector. But it is probably too soon for manufacturing and mining jobs and hours to rebound substantially in the coming months.
Hours worked in the services sectors continued performing well.


Wages:

Wages (average hourly earnings) increased In October.
Wages for all employees rose by 2.45% yoy (vs 2.2% in September) and for production worker rose 2.2% yoy (vs 1.9% in September). Overall, as the chart below shows, average hourly earnings have consistently grown at about 2.1% p.a in the last three years.


Household income:

Good. Close to the trend observed in the last three years.


Goods sector nominal income rebounded.

Services sector income also back to a healthy trend.


Household report:

The labor force participation rate moved 'sharply' down in September to 62.4% and remained at the same level in October, breaking what had appeared to be a stable level. It is interesting to highlight that the most LFPR managed to do was to stabilize in 2014 -- a year in which job creation and labor market conditions improved quite substantially. If the LFPR resumes its structural downtrend it could put the Fed in a position where they see labor slack shrinking faster than what they forecast, despite a similar economic growth outlook.

The broader measure of unemployment (U-6), which includes marginally attached, discouraged workers, and employed part time for economic reasons is falling faster than the headline unemployment.

The median forecast for unemployment rate in the Fed's SEP (Summary of Economic Projections) is 4.8% for 2016, 2017 and 2018. Assuming a flat LFPR, a forecast of 4.8% unemployment rate by the end of 2016 is compatible with average employment growth of 135k/month, substantially lower than the current pace of job growth.


As a reference, even a slowdown in employment growth from 2.3% currently to 1.5% yoy (the floor observed since mid-2011 was 1.8% yoy) would be equivalent to monthly employment gains of 178k and this would lead to a 4.4% unemployment rate by the end of 2016. Bottom line: LFPR needs to rebound (or job creation to settle at a very low level) for a 4.8% unemployment forecast to be attainable.

See detailed charts below:


The chart below shows unemployment rate (and short-term unemployment) and the recent tightening cycles (yellow). The short-term unemployment rate is at the lows.

Long term unemployment rate is improving faster. Moreover, the 'shadow' labor (i.e., the gap between U-6 and the headline unemployment rate) is also improving faster in the recent months. This is a clear sign that the labor market continues improving.


October employment by category - chart pack

Posted on November 6th, 2015

The charts below show employment by category. The blue line is total employment in the category, the orange bar is monthly change and the red line is the linear regression in the last two years.

Total payroll increased 271k in October, after a 137k growth in September (which was revised down from 142k). The trend for the last 6 months slowed from 280k/month by the end of last year to 215k in the 6 months to October.

Private payroll increased 268k in October, after 149k growth in September (revised up from 118k).
The trend for the last 6 months slowed from 270k/month by the end of last year to 201k in the 6 months to October.

Most of the slowdown in the pace of job creation was concentrated in the goods producing sector (mining and manufacturing); a concern last month was that this slowdown could be spreading to the services sector but October's data (and revisions) showed a healthy pace of job creation. Overall, the 6-month pace of job creation in the goods sector slowed from 50k (at the end of last year) to close to zero, while in the services sector it slowed from 220k to 201k in the same comparison.

Employment categories
Total nonfarm
Total private
Goods-producing
Mining and logging
Construction
Manufacturing
Private service-providing
Trade, transportation, and utilities
Wholesale trade
Retail trade
Transportation and warehousing
Utilities
Information
Financial activities
Professional and business services
Temporary help services
Education and health services
Educational services
Health care and social assistance
Leisure and hospitality
Other services
Government


Total nonfarm (trend from 243.9 to 242.7 to 242.1/m)


Total private (trend from 238.2 to 235.6 to 235.0/m)


Goods-producing (trend from 37.5 to 34.8 to 32.4/m)


Mining and logging (trend from -0.5 to -1.1 to -1.5/m)


Constructions (trend from 23.2 to 22.4 to 21.8/m)


Manufacturing (trend from 15 to 14.1 to 13.0/m)


Private service-providing (trend from 200.8 to 200.8 to 202.6/m)


Wholesale trade (trend from 8.2 to 7.9 to 7.8/m)


Retail trade (trend from 24.1 to 24.0 to 23.9/m)


Transportation and warehousing (trend from 12.7 to 12.4 to 12.1/m)


Utilities (trend from 0.6 to 0.7 to 0.7/m)


Information (trend from 3.9 to 3.9 to 3.8/m)


Financial activities (trend from 11.4 to 11.6 to 11.8/m)


Professional and business services (trend from 53.5 to 53.7 to 54.2/m)


Temporary help services (trend from 12.2 to 11.9 to 11.7/m)


Educational services (trend from 4.6 to 4.2 to 4.1/m)


Health care and social assistance (trend from 37.8 to 39.1 to 40.9/m)


Leisure and hospitality (trend from 37.2 to 37.1 to 37.1/m)


Other services (trend from 6.6 to 6.2 to 6.1/m)


Government (trend from 5.7 to 7.0 to 7.1/m)


US labor market conditions suggest job creation higher than observed in Aug/Sep

Posted on November 4th, 2015

Labor Market Conditions

Extracting a common trend

One possibility to summarize labor market conditions is to extract a common trend from several labor market indicators.

Based on previous work from Atlanta Fed (Labor Spider Chart) and from Kansas Fed (Assesing Labor Market Conditions), among others, I’ve compiled a list of labor market indicators: unemployment rate, employment to population ratio, labor force growth, U6 unemployment, short-term unemployment,job losers, unemployment longer than 27 weeks, involuntary part-time, hires, separations, quits, NFIB employment, NFIB plans to hire, Challenger job cuts, jobs plentiful, jobs hard to get, initial claims, Michigan consumer confidence, ISM employment, temp help, average hourly earnings, weekly hours index, weekly payroll index, employment diffusion index, Gallup job creation index.

It is possible to consolidate all the information in the list of labor market indicators in a few orthogonal components using principal component analysis (PCA). The table below shows that the first seven factors explain 92.9% of the data set variance. The first two factors explain 79% of the variance.

The table below illustrates this:

Table: Principal Components - proportion of variance accounted by each PC
PC1PC2PC3PC4PC5PC6PC7
Standard deviation4.0642.3661.2040.9000.7880.7300.691
Proportion of Variance0.5900.2000.0520.0290.0220.0190.017
Cumulative Proportion0.5900.7900.8420.8710.8930.9120.929

It is possible, then, to reconstruct the private payroll time series using just the main principal components (PCs). The idea is that the filtered private payroll built this way would embed the common trend among all the labor market variables in the data set, and therefore filter away the idiosyncratic part of the payroll leaving only the true underlying data.

The table below shows the results of a linear regression of private payroll on the first two principal components. One can see that the first two factors are able to explain a high proportion of private payroll variability (R2=0.85).

Adding factors three to seven increases R2 to 0.91. Results can be seen in the table below.

Regression Results
Private Payroll
(1)(2)
Constant63.31*** (7.00)63.31*** (5.49)
PC150.63*** (1.73)50.63*** (1.35)
PC223.60*** (2.96)23.60*** (2.32)
PC3-42.02*** (4.57)
PC4-4.16 (6.13)
PC5-16.34** (6.99)
PC6-20.76*** (7.53)
PC723.83*** (7.99)
N166166
R20.850.91
Adjusted R20.850.91
Residual Std. Error90.16 (df = 163)70.70 (df = 158)
F Statistic461.55*** (df = 2; 163)229.75*** (df = 7; 158)
Notes:***Significant at the 1 percent level.
**Significant at the 5 percent level.
*Significant at the 10 percent level.

Results for Sep/2015

The chart below plots the actual payroll printed (dots) and the underlying trend using the first two PCs.

The latest private payroll was 118 thousands (Sep/2015), while the underlying trend suggest payroll running at 233 thousands/month.

The underlying trend obtained adding factors three to seven becomes a bit more volatile, but suggest an uderlying trend running at around 194 thousands/month.

Bottom line

  • Latest payroll was 118 thousands (Sep/2015).
  • The average of the last 3 months was 138 thousands/month.
  • The common trend extracted from labor market indicators suggests underlying payroll running at around 194 thousands/month.

Dr. Paulo Gustavo Grahl, CFA (2015-11-04)


JOLTS - chartpack (Aug-15): robust labor market

Posted on October 16th, 2015


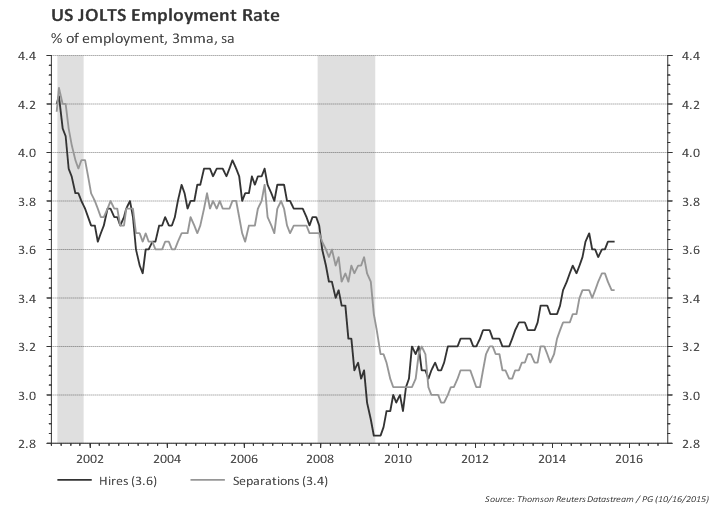
Hires rate at a healthy level. Separations rate also trending up; separations include voluntary quits, layoffs, and others.

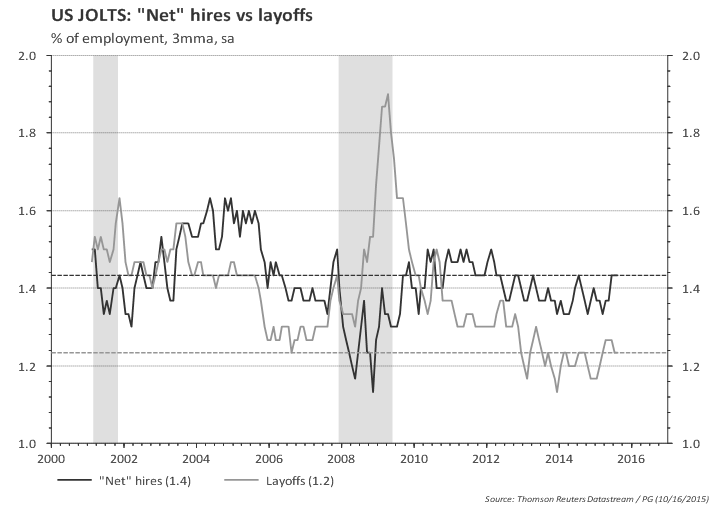
Assuming voluntary quits and others (e.g., retirement) are part of the 'normal' labor market, we can split the above chart into 'net' hires (i.e, hires minus quits and minus others) and layoffs:

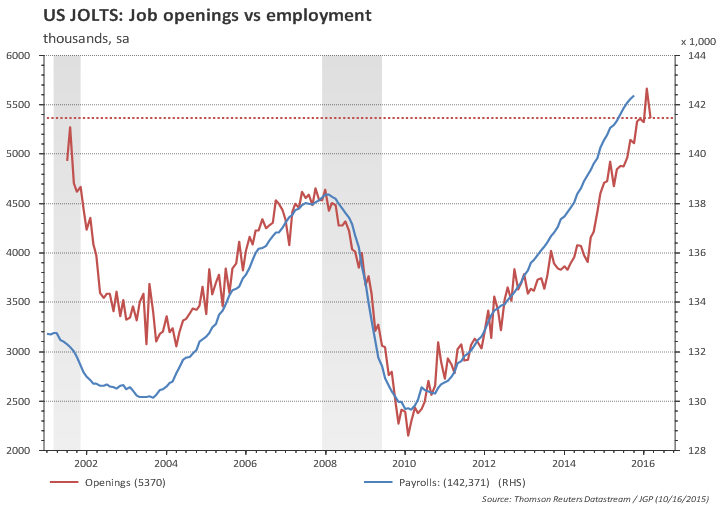
There are 5.4 million job openings in the US...

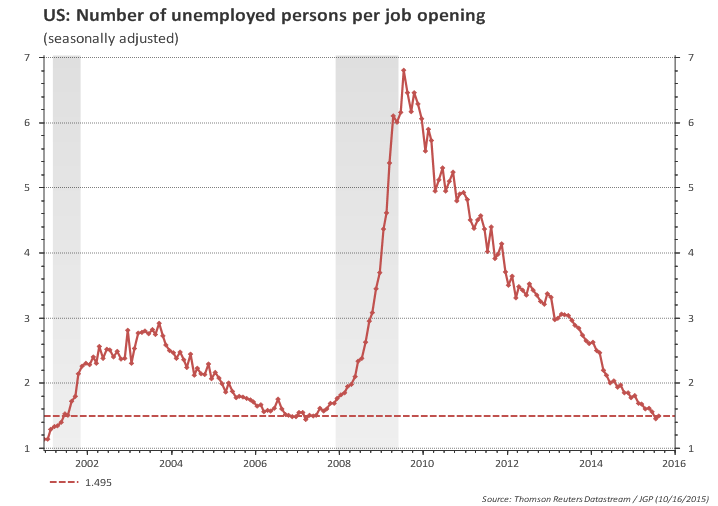
...and 7.9 million unemployed

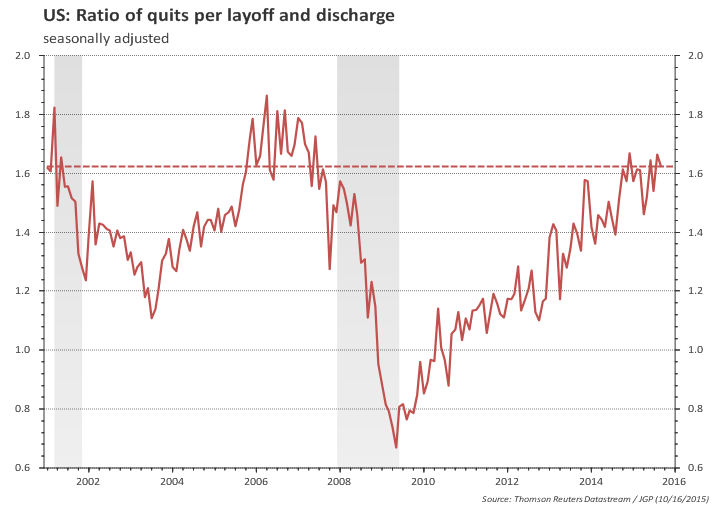
Quits ratio is high relative to layoffs.

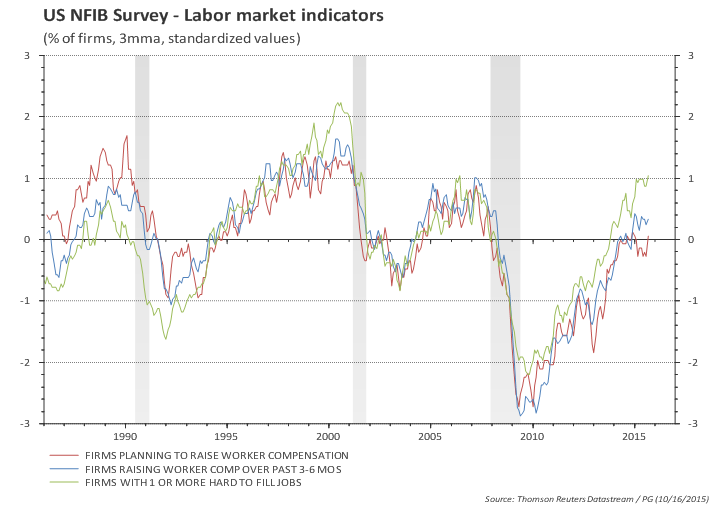
No wonder some companies are having hard time finding people to work...

...despite paying higher wages and planning to continue to increase wages

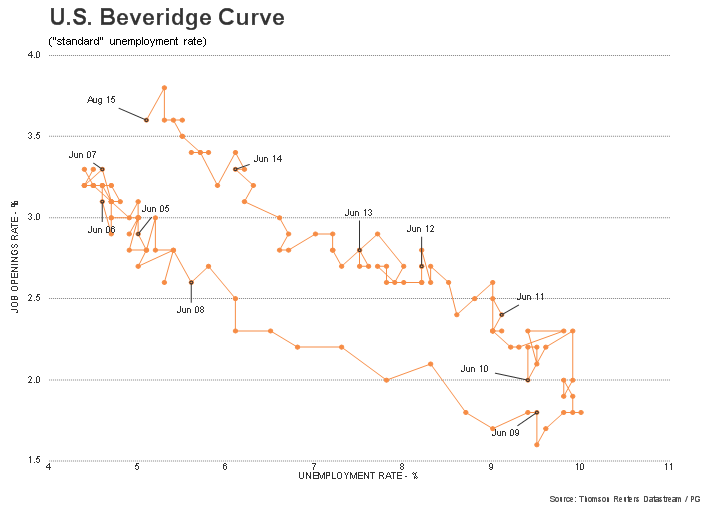
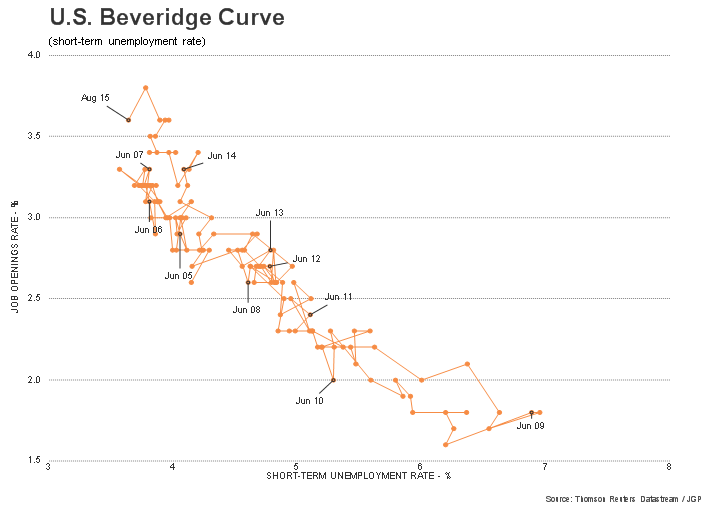
Current job openings rate was, in the past, compatible with much lower unemployment rates...

...but the bulk of the difference is long-term unemployment; short term unemployment rate is close to the previous cycle low (2007); interestingly short-term unemployment rate seems to have stalled at current low levels.


Paulo Gustavo Grahl, CFA

Random comments on macro data. Views are my own. Except when they aren't.