Main takeaways:
- Dovish hike delivered; the gradual base case is 100bp/year, but market is not convinced; Fed emphasizes policy remains accommodative.
- Key reason for moving (when inflation is still low): monetary policy has lags; a delay increases risk of abruptly tightening later.
- Reference to actual inflation and that inflation expectations have to be well anchored probably helped to bring the doves on board.
- However, the hurdle for inflation is not very demanding -- underlying PCE momentum is running in the 1.2%-1.5% range and the Fed central tendency forecasts for 2016 is 1.2%-1.7%.
- Fed expects neutral fed funds (r*) to raise only gradually; markets, on the other hand, are betting on a secular stagnation type of story -- r* remains zero for the next two years and monetary policy stance remains even more accommodative than today.
FOMC | Comments |
Policy decision | Raise the target range for the federal funds rate to 1/4 to 1/2 percent. Monetary policy remains accommodative.
Reinvestment policy will continue until "normalization of the level of the federal funds rate is well under way" -- this should "reduce the risk that fed funds rate might return to the effective lower bound in the event of future adverse shocks". |
Why? | "Considerable progress that has been made toward restoring jobs, raising incomes, and easing the economic hardship of millions of Americans", and reflects "confidence that the economy will continue to strengthen". The recovery, however "is not yet complete": there's room for labor market to improve further and inflation continues to run below 2%. So why increase rates?
a) softness in inflation is due to transitory factors that should abate over time;
b) diminishing slack should put upward pressure on inflation as well;
c) it takes time for monetary policy actions to affect future economic outcomes;
d) a delay of normalization (for too long) increases risk of abruptly tightening policy at some point to avoid overshooting the goals.
|
Risks | Risks are balanced. |
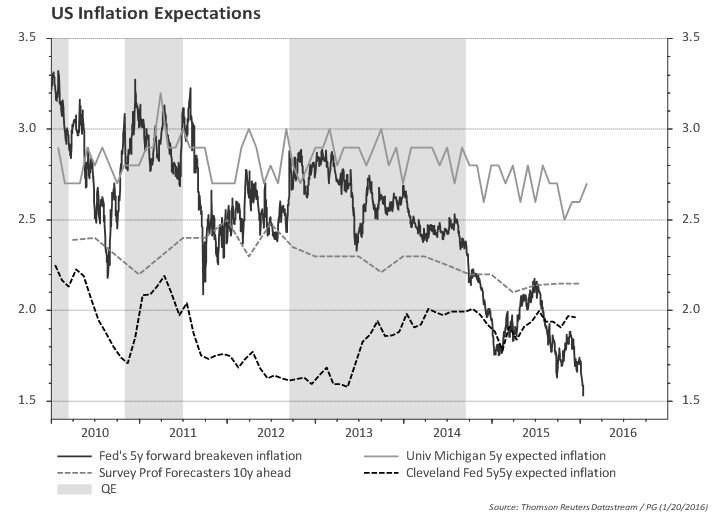
Policy outlook | In "determining the timing and size of future adjustments", FOMC "will carefully monitor actual and expected progress toward our inflation goal". Also, FOMC confidence in the inflation outlook rests importantly on its judgment that longer-run inflation expectations remain well anchored.
Normalization process likely to proceed gradually. This is consistent with the view that neutral nominal fed funds rate (r*) is currently low by historical standards.
FOMC expects that with "gradual adjustments in the stance of monetary policy" economic activity will continue to expand at a moderate pace and labor market indicators will continue to strenghten -- by how much? look at forecasts. |
Discussion on equilibrium / neutral fed funds rate (r*)
The FOMC expects federal funds rate to remain, for some time, below levels that are consistent with its longer run assessment. The key rational behind this idea is that for that is the neutral rate (r*) is currently low and will only move gradually towards its long term level.
Why is r* low?
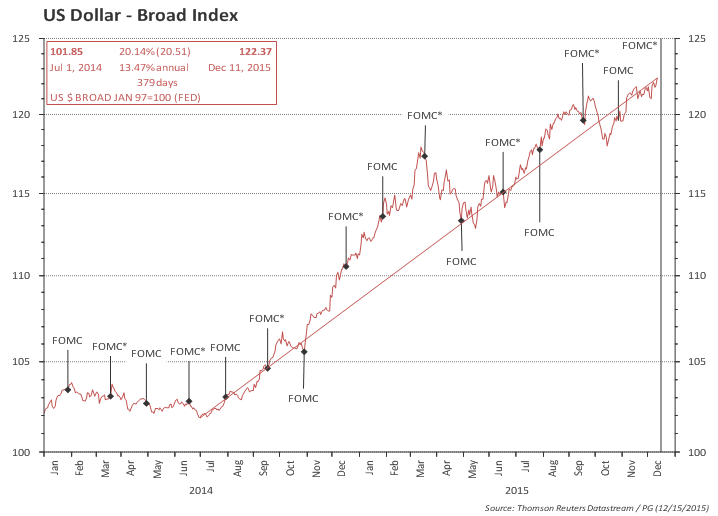
Because of the headwinds: tighter underwriting standards, limited access to credit, deleveraging, contractionary fiscal policy, weak growth abroad, significant appreciation of the dollar, slower productivity and labor force growth, elevated uncertainty about economic outlook.
These have declined noticeably over the past few years, but some have remained significant. As these abate, r* should gradually move higher over time -- this can be seen in the SEP.
How do you know for sure that r* is low?
One indication is that growth has been only moderate despite very low level of funds rate and the large balance sheet. Had r* been higher, economic expansion would have been much more rapid.
How low?
During the October FOMC meeting the staff briefed participants about the topic and the conclusion leaned towards:
- r* was negative in the aftermath of the 2008-09 financial crisis and is currently close to zero.
- Equilibrium level of r* would likely remain low relative to estimates before the financial crisis (due to productivity and demographic factors). This is reflected in SEP's forecast of 1.5% real rate in the long run (below the 2% used in the past).
According to the Taylor rule mentioned by Yellen (
Yellen's preferred Taylor rule) on her remarks earlier this year (
Normalizing Monetary Policy), even considering r*=0 (the
green line in the chart below) the Fed would already be behind the schedule. An r*=0 (and current readings on PCE inflation and unemployment rate) would imply fed funds approximately
50bp higher -- this is why the Fed calls the monetary policy stance
accommodative (below the neutral).
The fact that the slope of the 'dots' curve is higher than the green line reflects the idea of r* gradually moving higher over time. Market forecasts, on the other hand, are betting on a secular stagnation type of story -- r* remains zero for the next two years and monetary policy stance remains a bit more accommodative as it is today (a bit more than 50bp below the r*=0 line).
Emphasis on actual inflation
The newly introduced actual in the sentence "the Committee will carefully monitor actual and expected progress toward our inflation goal" was probably key to bring the doves on board (the other was the reference to the reinvestment policy, which would continue until "normalization of the level of the federal funds rate is well under way" -- this probably helped to please Brainard).
However, the Committee was smart enough to leave this comment flexible enough to avoid tyeing the Fed to a given path of inflation. Chair Yellen ably avoided giving any hard target when questioned by reporters. They avoided the historical mistake of the 6.5% unemployment target...
"Now, I've tried to explain in many of my -- and many of my colleagues have as well why we have reasonable confidence that inflation will move up over time, and the committee declared it had reasonable confidence. Nevertheless, that is a forecast. We really need to monitor over time actual inflation performance to make sure that it is conforming, it is evolving, in the manner that we expect. So it doesn't mean that we need to see inflation reach 2 percent before moving again, but we have expectations for how inflation will behave, and were we to find that the underlying theory is not bearing out, that it is not behaving in the manner that we expect, and that it doesn't look like the shortfall is transitory and disappearing with tighter labor markets, that would certainly give us pause. And we have indicated that we are reasonably close, not quite there, but reasonably close to achieving our maximum employment objective. But we have a significant shortfall on inflation. So we are calling attention to the importance of verifying that things evolve in line with our forecasts."
"I'm not going to give you a simple formula for what we need to see on the inflation front, in order to raise rates again. We will also be looking at the path of employment as well as the path for inflation. But if incoming data were, led us to call into question the inflation forecast that we have set out, and that could be a variety of different kinds of evidence, that would certainly give the committee pause. But I don't want to say there is a simple benchmark. The committee expects inflation over the next year at the median expectation is for inflation to be running about 1.6 percent. And both core and headline, so we do expects it to be moving up, but we don't expect it to reach 2 percent."
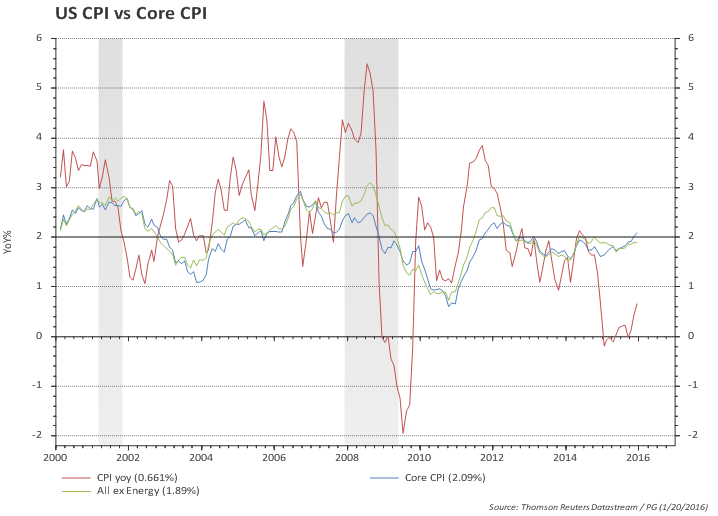
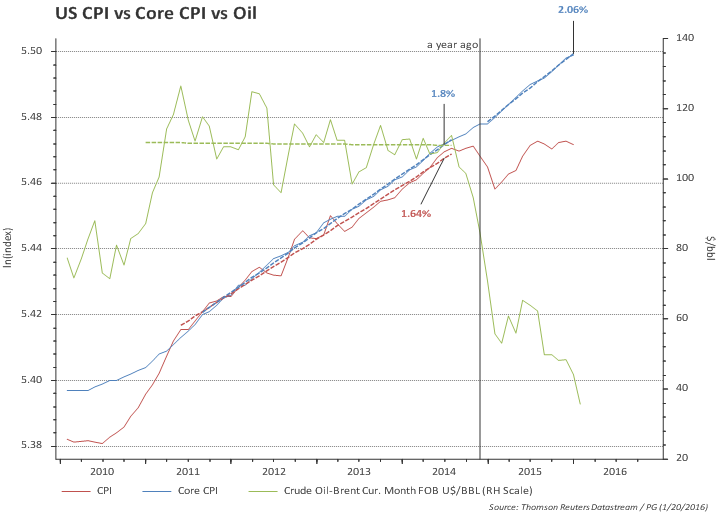
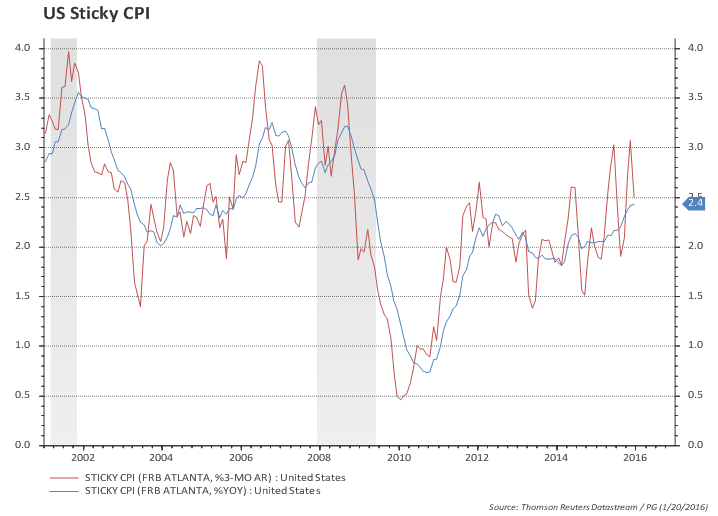
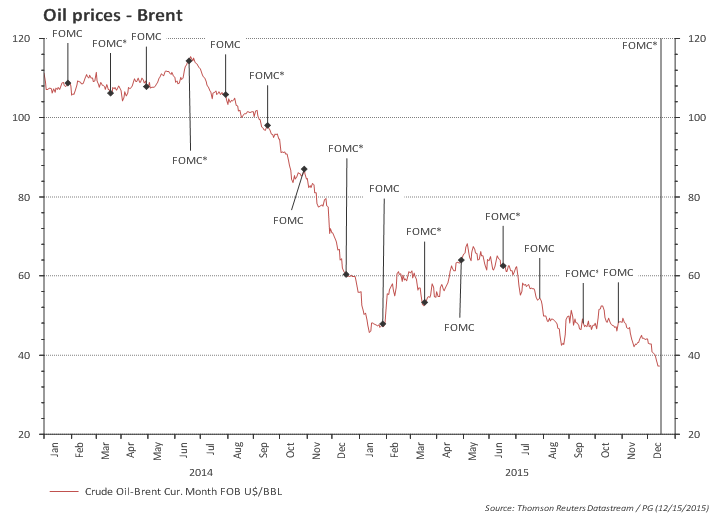
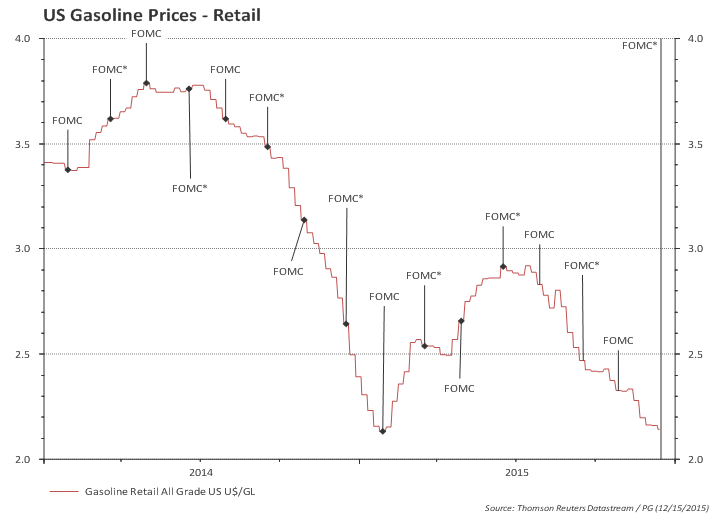
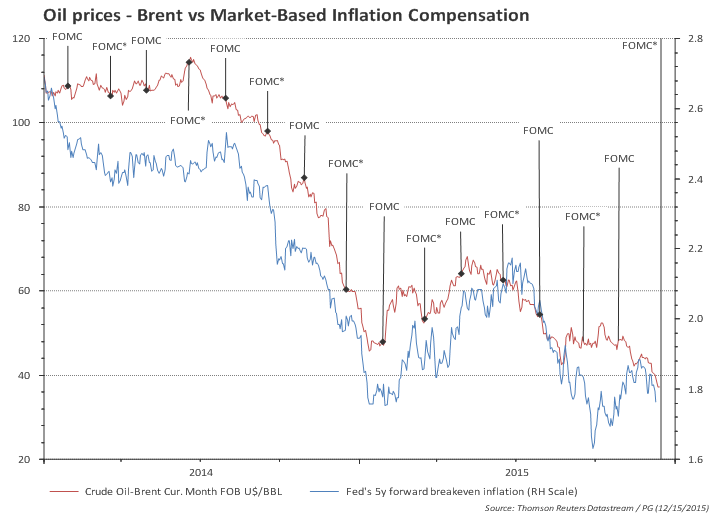
The chart below gives a good picture of recent inflation performance. Both headline and core inflation were increasing at the same pace (about 1.5%) from late 2011 to mid 2014, when oil prices were roughly flat. From October 2014 to January headline inflation dropped 0.8% (-3.4% annualized) reflecting the drop in energy prices, and has increased 1.1% until last October (about 1.4% annualized). This late rebound is headline prices is roughly in tandem with the pace of core inflation.
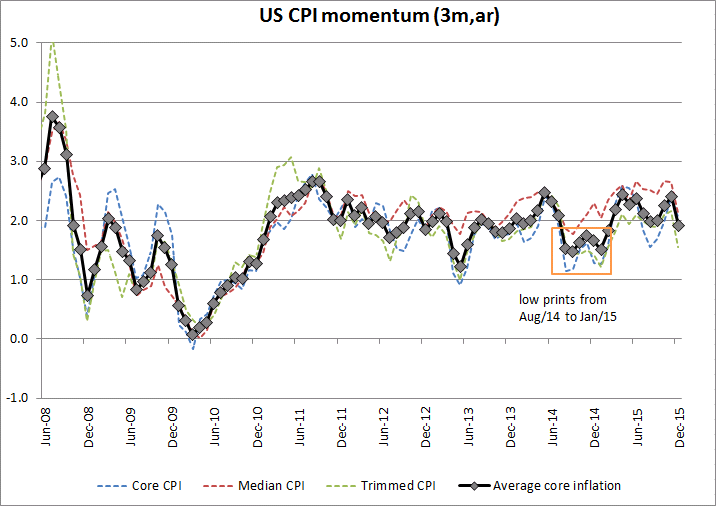
Core CPI inflation momentum is already running 2.4% (
details here) but the gap with PCE inflation has opened and core PCE momentum is in the 1.2%-1.5% range. The Fed expects PCE inflation in the 1.2% to 1.7% range in 2016 (central tendency) so the bar is
not very high.
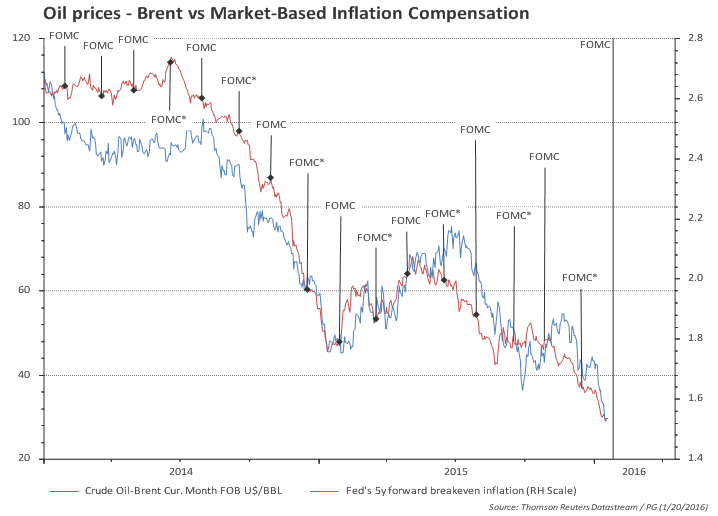
However, further decline in oil prices and/or strengthening of the dollar could easily delay Fed action.
FOMC reference scenario
The table below is a reference to the FOMC base case, which is compatible with "gradual adjustments in the stance of monetary policy" -- i.e., 100bp/year.
The evolution of the actual economic variables and the evolution of Fed's forecasts will tell whether the economy is ahead or behind the base case.
Chart 1) Evolution of Fed forecasts for unemployment and inflation
Unemployment rate | PCE inflation |
| |
| |
| |
|
|
Chart 2) Dots and the implied Taylor rule
| Taylor rule |
Fed funds in 2015 below the r*=0 Taylor rule -- meaning monetary policy stance is accommodative | |
Dots for 2016 still imply a accommodative policy stance -- even assuming r* remains at zero! | |
Dots for 2017 moved down, suggesting the Fed sees headwinds taking longer to abate. | |